Data Science/Side
[KDT] 서울시 코로나19 데이터 발생동향 EDA - 1
나는 정은
2022. 10. 12. 02:01
멋쟁이 사자처럼 5주차
2022.10.11
서울시에서 공개한 코로나19 발생동향 분석 - EDA (1)
0. 라이브러리 로드
import pandas as pd
import numpy as np
import matplotlib.pyplot as plt

# 시각화를 위한 한글 폰트 설정
import koreanize_matplotlib

%config InlineBackend.figure_format = 'retina'

# 파일 탐색 모듈
from glob import glob
1. 데이터 확인
# 정규식을 통해 파일 경로 검색
file_name = glob("seoul*.csv")
file_name
['seoul-covid19-2021-12-18.csv', 'seoul-covid19-2021-12-26.csv']df_01 = pd.read_csv(file_name[0])
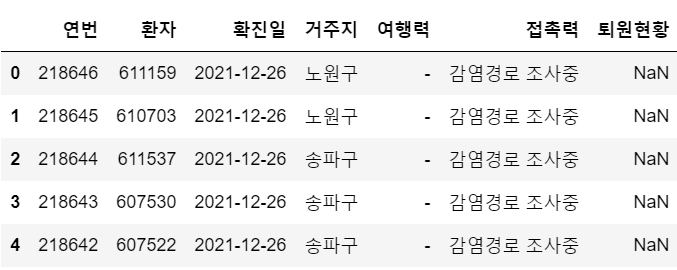
df_02 = pd.read_csv(file_name[1])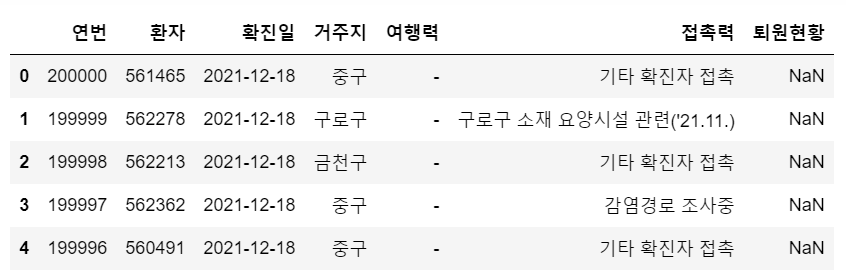
a. 두 데이터프레임 합치기 : pd.concat()
df = pd.concat([df_01, df_02])
df.shape
(218646, 7)b. 중복 데이터 제거 : df.drop_duplicates()
df[df.duplicated()]
df = df.drop_duplicates()c. 인덱스 값 설정 : set_index()
df.shape(218646, 7)df['연번'].nunique()218646- 연번 칼럼의 유일 값을 확인하여 중복이 없음을 확인하였다.
- shape , nunique() 를 통해 행의 수와 유일 값이 일치하는 지 확인한다.
- 최신 데이터부터 보기 위해 연번 내림차순 출력
df = df.set_index("연번").sort_index(ascending=False)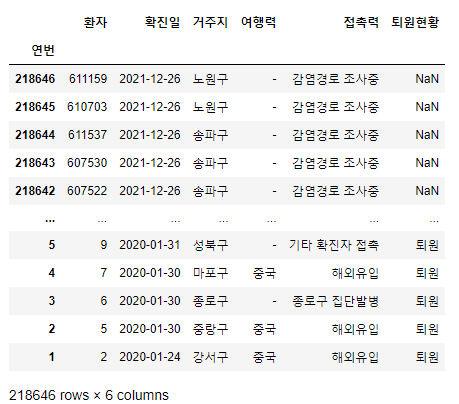
d. 각 데이터 attributes 확인
df.shape(218646, 6) # 인덱스가 연번으로 바뀌었으므로df.dtypes환자 int64
확진일 object
거주지 object
여행력 object
접촉력 object
퇴원현황 object
dtype: objectdf.columnsIndex(['환자', '확진일', '거주지', '여행력', '접촉력', '퇴원현황'], dtype='object')df.indexInt64Index([218646, 218645, 218644, 218643, 218642, 218641, 218640, 218639,
218638, 218637,
...
10, 9, 8, 7, 6, 5, 4, 3,
2, 1],
dtype='int64', name='연번', length=218646)2. 데이터 요약
a. 데이터 요약 정보 출력 : df.info()
df.info()<class 'pandas.core.frame.DataFrame'>
Int64Index: 218646 entries, 218646 to 1
Data columns (total 6 columns):
# Column Non-Null Count Dtype
--- ------ -------------- -----
0 환자 218646 non-null int64
1 확진일 218646 non-null object
2 거주지 218646 non-null object
3 여행력 218646 non-null object
4 접촉력 218646 non-null object
5 퇴원현황 163497 non-null object
dtypes: int64(1), object(5)
memory usage: 11.7+ MBb. 결측치 확인 : df.isnull()
# 결측치의 합계 출력
df.isnull().sum()
환자 0
확진일 0
거주지 0
여행력 0
접촉력 0
퇴원현황 55149
dtype: int64# 결측치의 비율 출력
df.isnull().mean() * 100환자 0.000000
확진일 0.000000
거주지 0.000000
여행력 0.000000
접촉력 0.000000
퇴원현황 25.222963
dtype: float64c. 기술 통계 출력 : describe()
df.describe() 환자
count 218646.000000
mean 322462.160977
std 173903.371149
min 2.000000
25% 168409.250000
50% 336181.500000
75% 470149.500000
max 611669.000000df.describe(include='object')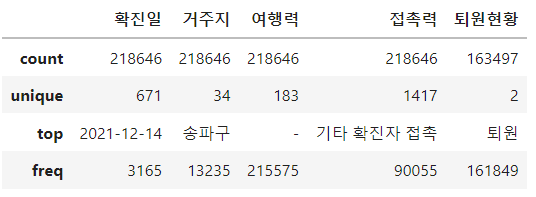
3. 파생변수 만들기
a. 날짜 데이터 type 변환 : pd.to_datetime()
df["확진일"] = pd.to_datetime(df["확진일"])b. 연, 월, 일, 요일 데이터 변수 생성 : dt.year , dt.month, dt.day, dt.dayofweek ..
df["연도"] = df["확진일"].dt.year
df["월"] = df["확진일"].dt.month
df["일"] = df["확진일"].dt.day
df["요일"] = df["확진일"].dt.dayofweek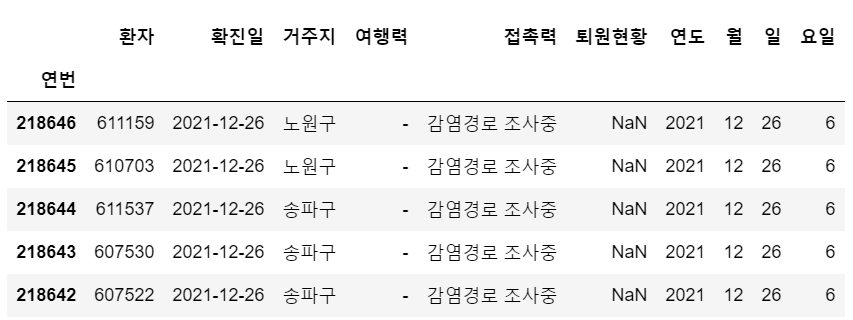
c. 연도-월 데이터 변수 생성 : str 슬라이싱
df['연월'] = df['확진일'].astype(str).str[:7]연번
218646 2021-12
218645 2021-12
218644 2021-12
218643 2021-12
218642 2021-12
...
5 2020-01
4 2020-01
3 2020-01
2 2020-01
1 2020-01
Name: 연월, Length: 218646, dtype: objectd. 요일 데이터 값 숫자에서 한글로 변환하기 : series.map()
def find_dayofweek(day_no):
    d = '월화수목금토일'
    return d[day_no]
df['요일명'] = df['요일'].map(find_dayofweek)
# 또는 익명함수 lambda 사용 가능
df["요일명"] = df['요일'].map(lambda x : '월화수목금토일'[x])연번
218646 일
218645 일
218644 일
218643 일
218642 일
..
5 금
4 목
3 목
2 목
1 금
Name: 요일명, Length: 218646, dtype: objecte. 각 변수에 대한 빈도수 출력 : value_counts()
연도에 대한 확진 빈도수
df["연도"].value_counts()2021 199253
2020 19393
Name: 연도, dtype: int64# "연도" 컬럼의 비율
df["연도"].value_counts(normalize=True) * 1002021 91.130412
2020 8.869588
Name: 연도, dtype: float64연도-월에 대한 확진 빈도수
df["연도월"].value_counts().sort_index().plot()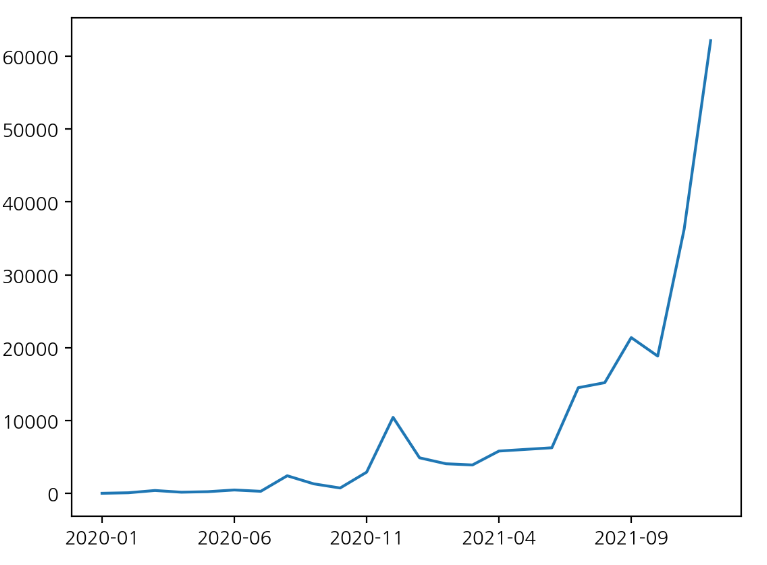
year_month.plot(kind='bar',rot=80)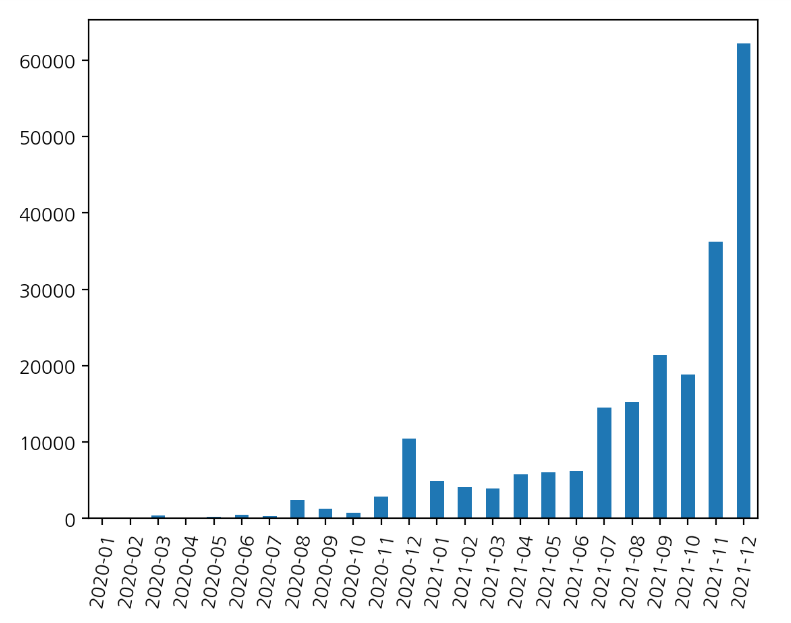
요일에 대한 확진 빈도수
df['요일명'].value_counts()화 35471
수 34548
목 34030
금 33655
토 30692
일 25734
월 24516
Name: 요일명, dtype: int64- 리스트 컴프리헨션을 통해 칼럼 순서를 바꿀 수 있음.
weekday_cnt[list("월화수목금토일")].plot(kind='bar', figsize = (10,3), rot = 0)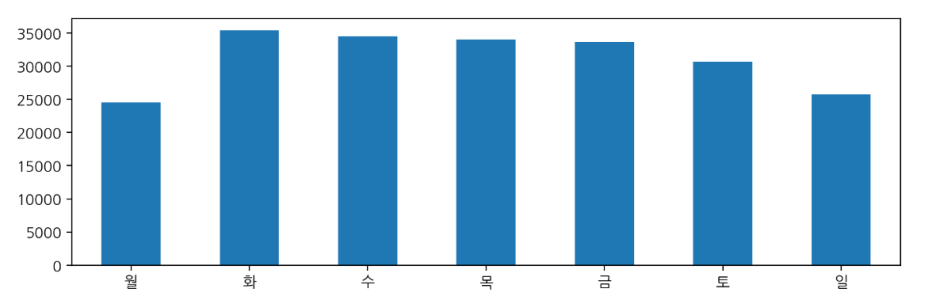
- 재미있는 인사이트
- 월요일에 확진자 수가 적은 이유는 주말에는 선별진료소가 휴무였기 때문 !
확진일에 대한 확진 빈도수
day_count = df['확진일'].value_counts().sort_index()day_count.plot(title='일별 확진자 수', figsize=(10,3))
plt.axhline(1500, c='r', lw='0.5', ls='solid')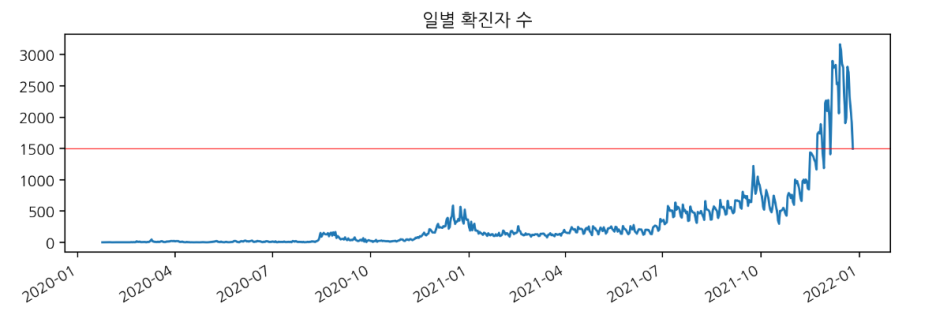
Reference
멋쟁이 사자처럼 ai스쿨 "오늘코드" 박조은 강사님께 제공받은
서울시 코로나19 확진자 현황(2020~2021) 데이터를 바탕으로 탐색적 데이터 분석을 수행
GitHub - corazzon/COVID-19-eda: COVID-19-eda
COVID-19-eda. Contribute to corazzon/COVID-19-eda development by creating an account on GitHub.
github.com